PRODUCT CASE STUDY · AI PRODUCT / B2B MARKETPLACE
Designing an AI matching systemfor a B2B marketplace.
I researched the marketplace's data and workflows to find where value was being lost.
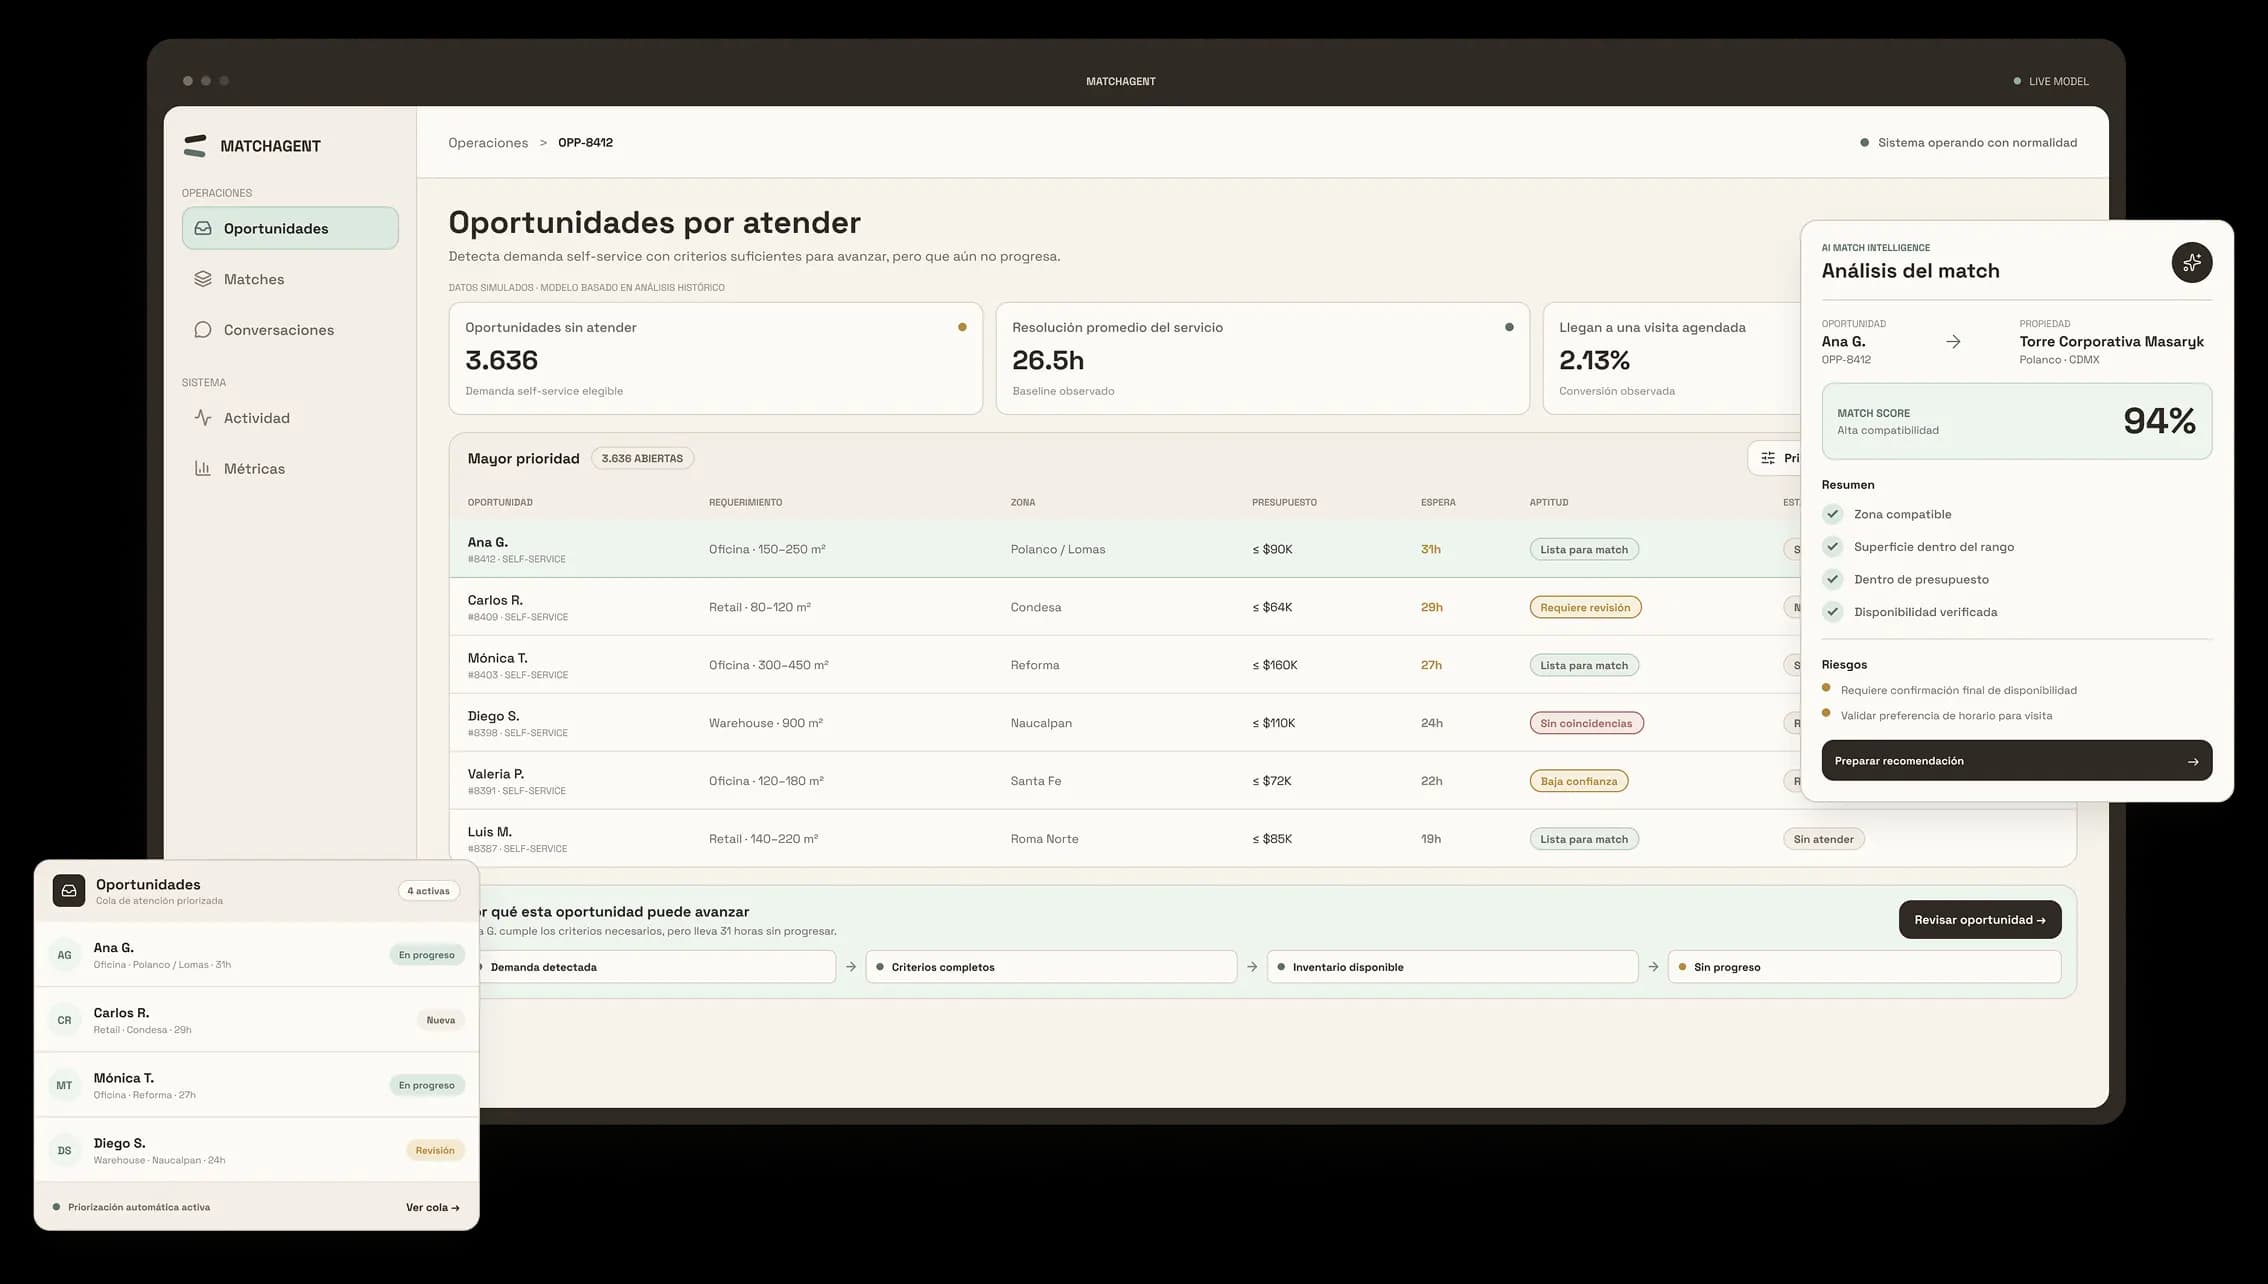
Interface shown in Spanish — built for a Mexican marketplace.
01 / CONTEXT
The challenge wasn't designing a feature. It was finding which problem deserved solving.
The hackathon asked for an AI-native initiative. Instead of starting from a solution, I used my access to operational data to find where the system was losing value.
OPEN BRIEF
Propose an AI-native initiative.
The starting point was broad, with no concrete problem and no defined solution.

PRODUCT QUESTION
Where is the system losing value?
Before thinking about technology, I had to find friction that was observable and relevant.

DECISION
Research how the marketplace actually behaves.
The search focused on leads, visits, inventory, matching, and operations.

DIRECTION
Turn operational signals into an opportunity.
The research would show whether a valuable product intervention existed.

02 / OPERATIONAL SIGNAL
There were opportunities in the system that almost never reached a visit.
The drop wasn't at the start of the journey. It was at the end.
Demand existed, criteria were complete, and inventory was available. The loss came before that intent turned into a visit.
TOTAL DEMAND
100%
Opportunities detected in the system.
COMPLETE CRITERIA
92%
With budget, location, and size defined.
AVAILABLE INVENTORY
78%
Active units that could be matched at that moment.
VISIT SCHEDULED
2.13%
Almost no opportunity completed the journey.
DIAGNOSIS
The bottleneck wasn't capturing demand or finding inventory. It was turning that intent into a next action.
03 / SYSTEMIC RESEARCH
Before designing a solution, I questioned four parts of the system.
SYNTHESIS
COMMON PATTERN
The friction didn't live on one screen or in one team. It repeated across the system as the same continuity failure.
A break in operational continuity
- 01LEAD → VISIT
QUESTION
At which step does the user's progress fade?
SIGNAL
Fewer than 3% scheduled a visit.
- 02PRODUCTIVITY
QUESTION
Is human attention spread evenly?
SIGNAL
80% of the work fell on a few brokers.
- 03INVENTORY + MATCH
QUESTION
Is there an objective fit between inventory and searches?
SIGNAL
Over 85% had matches that were never connected.
- 04SELF-SERVICE
QUESTION
What happens to people who come in without an assigned broker?
SIGNAL
Over 3,600 orphaned opportunities.
04 / INSIGHT
The problem wasn't generating more demand. It was better connecting the demand that already existed.
All four lines of research pointed to the same conclusion: the system already had demand, criteria, and inventory. What it lacked was a layer that could connect them into a next action.
05 / STRATEGIC DECISION
We needed an active orchestration layer.
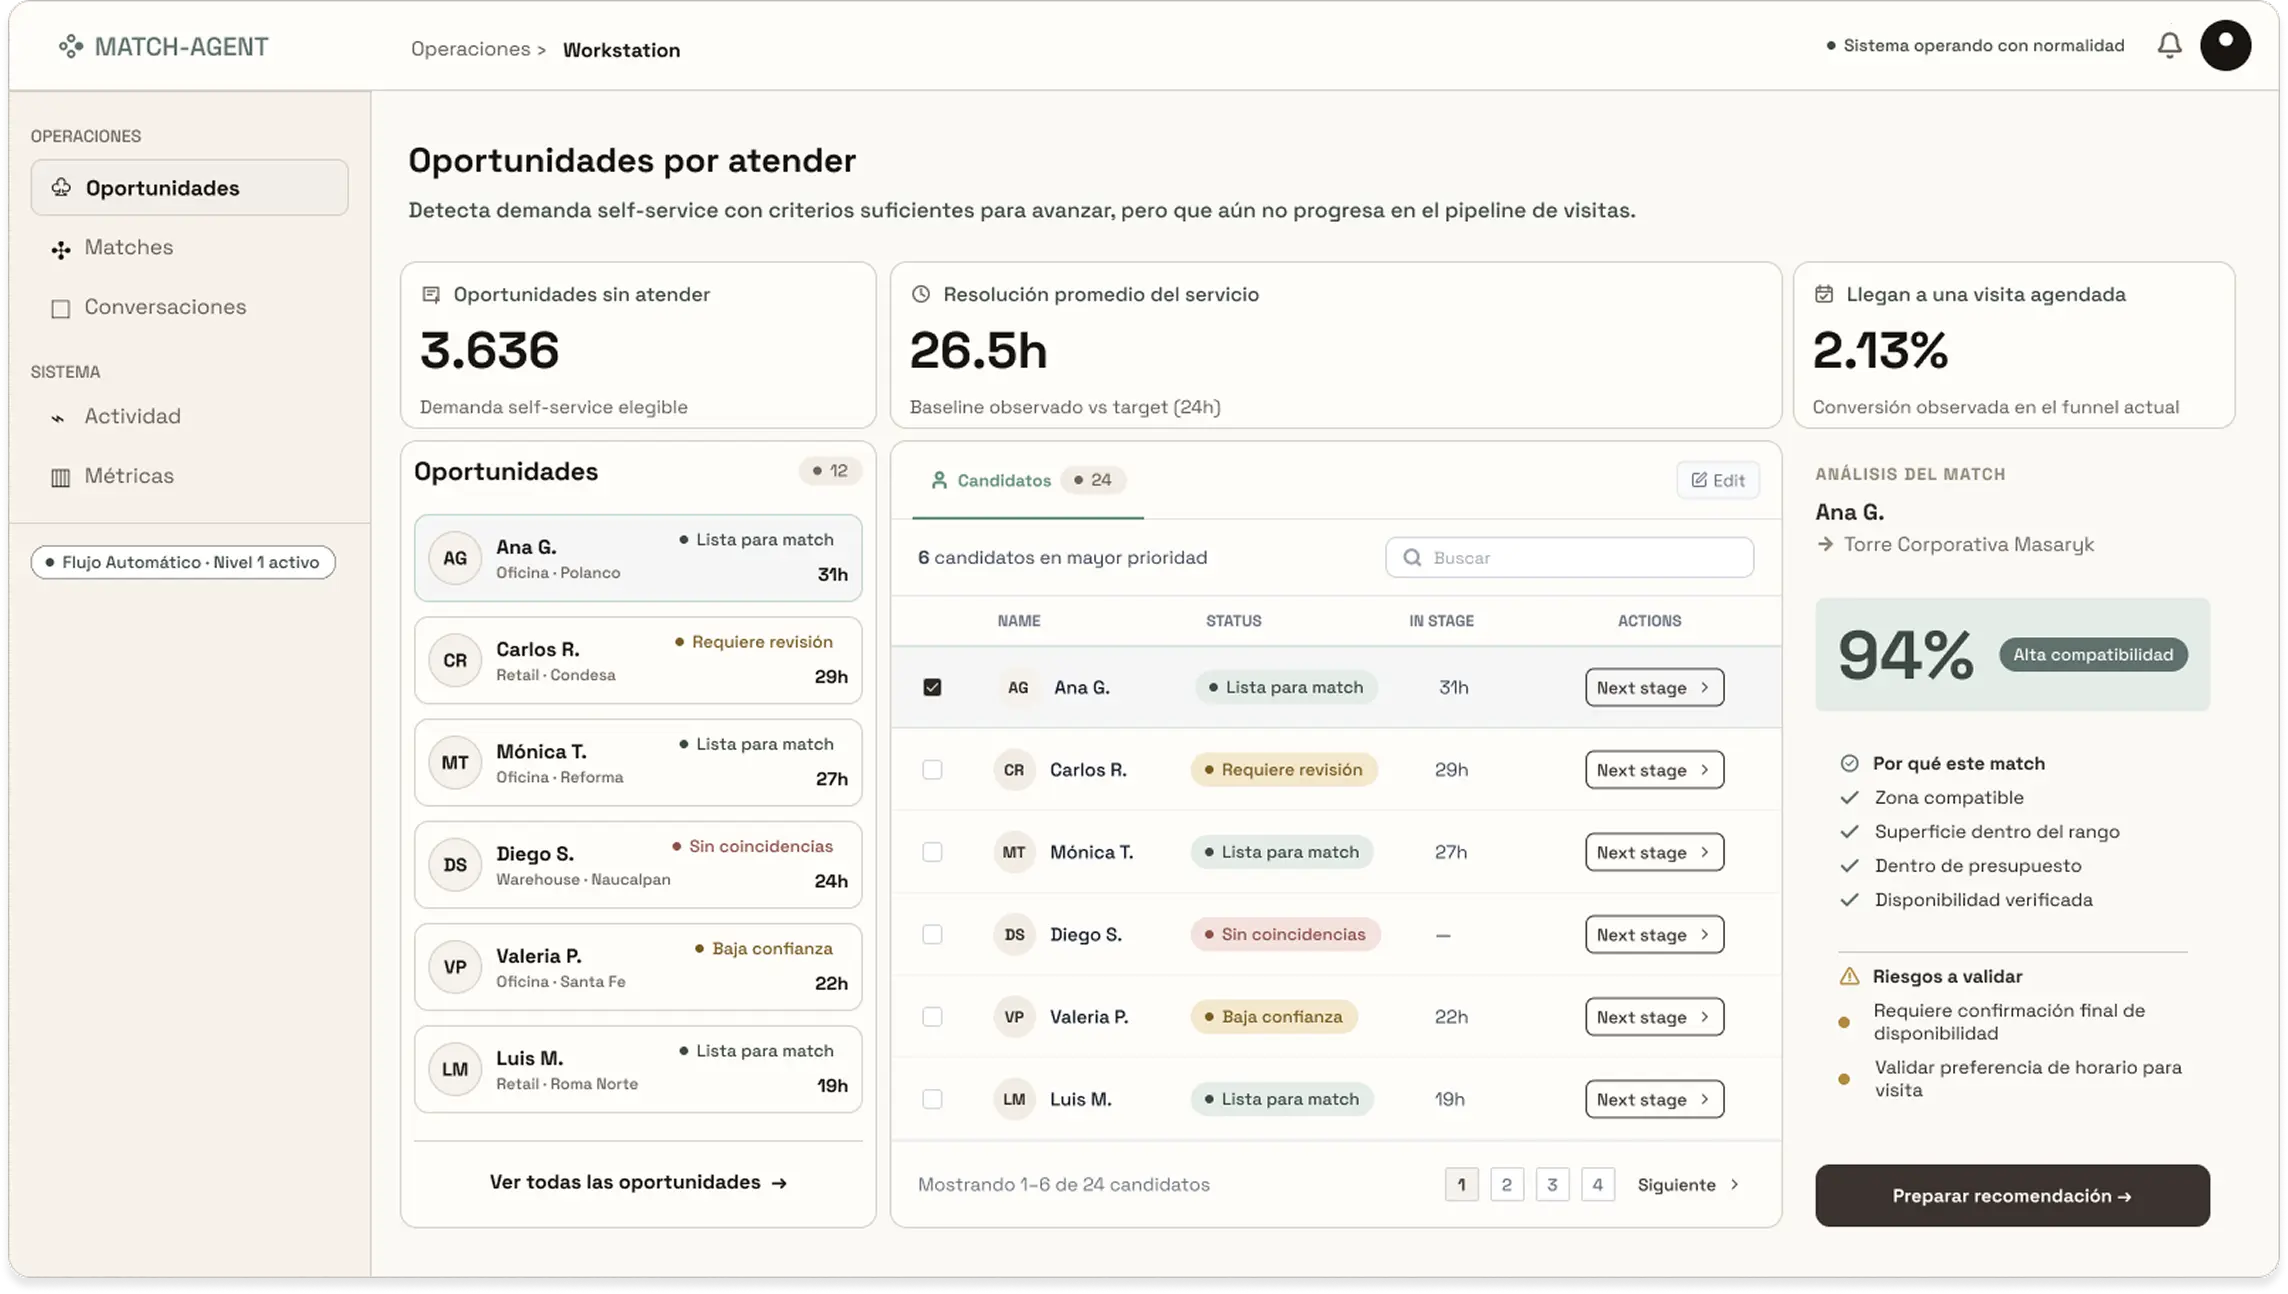
06 / PRODUCT
One opportunity, from signal to visit.
CASE JOURNEY · ANA G.
- Active
NO PROGRESS FOR 31H
Inactivity signal detected.
INTERPRETED
Profile analyzed by the model.
- 94%
MATCH 94%
Best-fit property identified.
RECOMMENDATION SENT
Recommendation sent to Ana G.
- Goal
VISIT SCHEDULED
Meeting confirmed with Ana G.
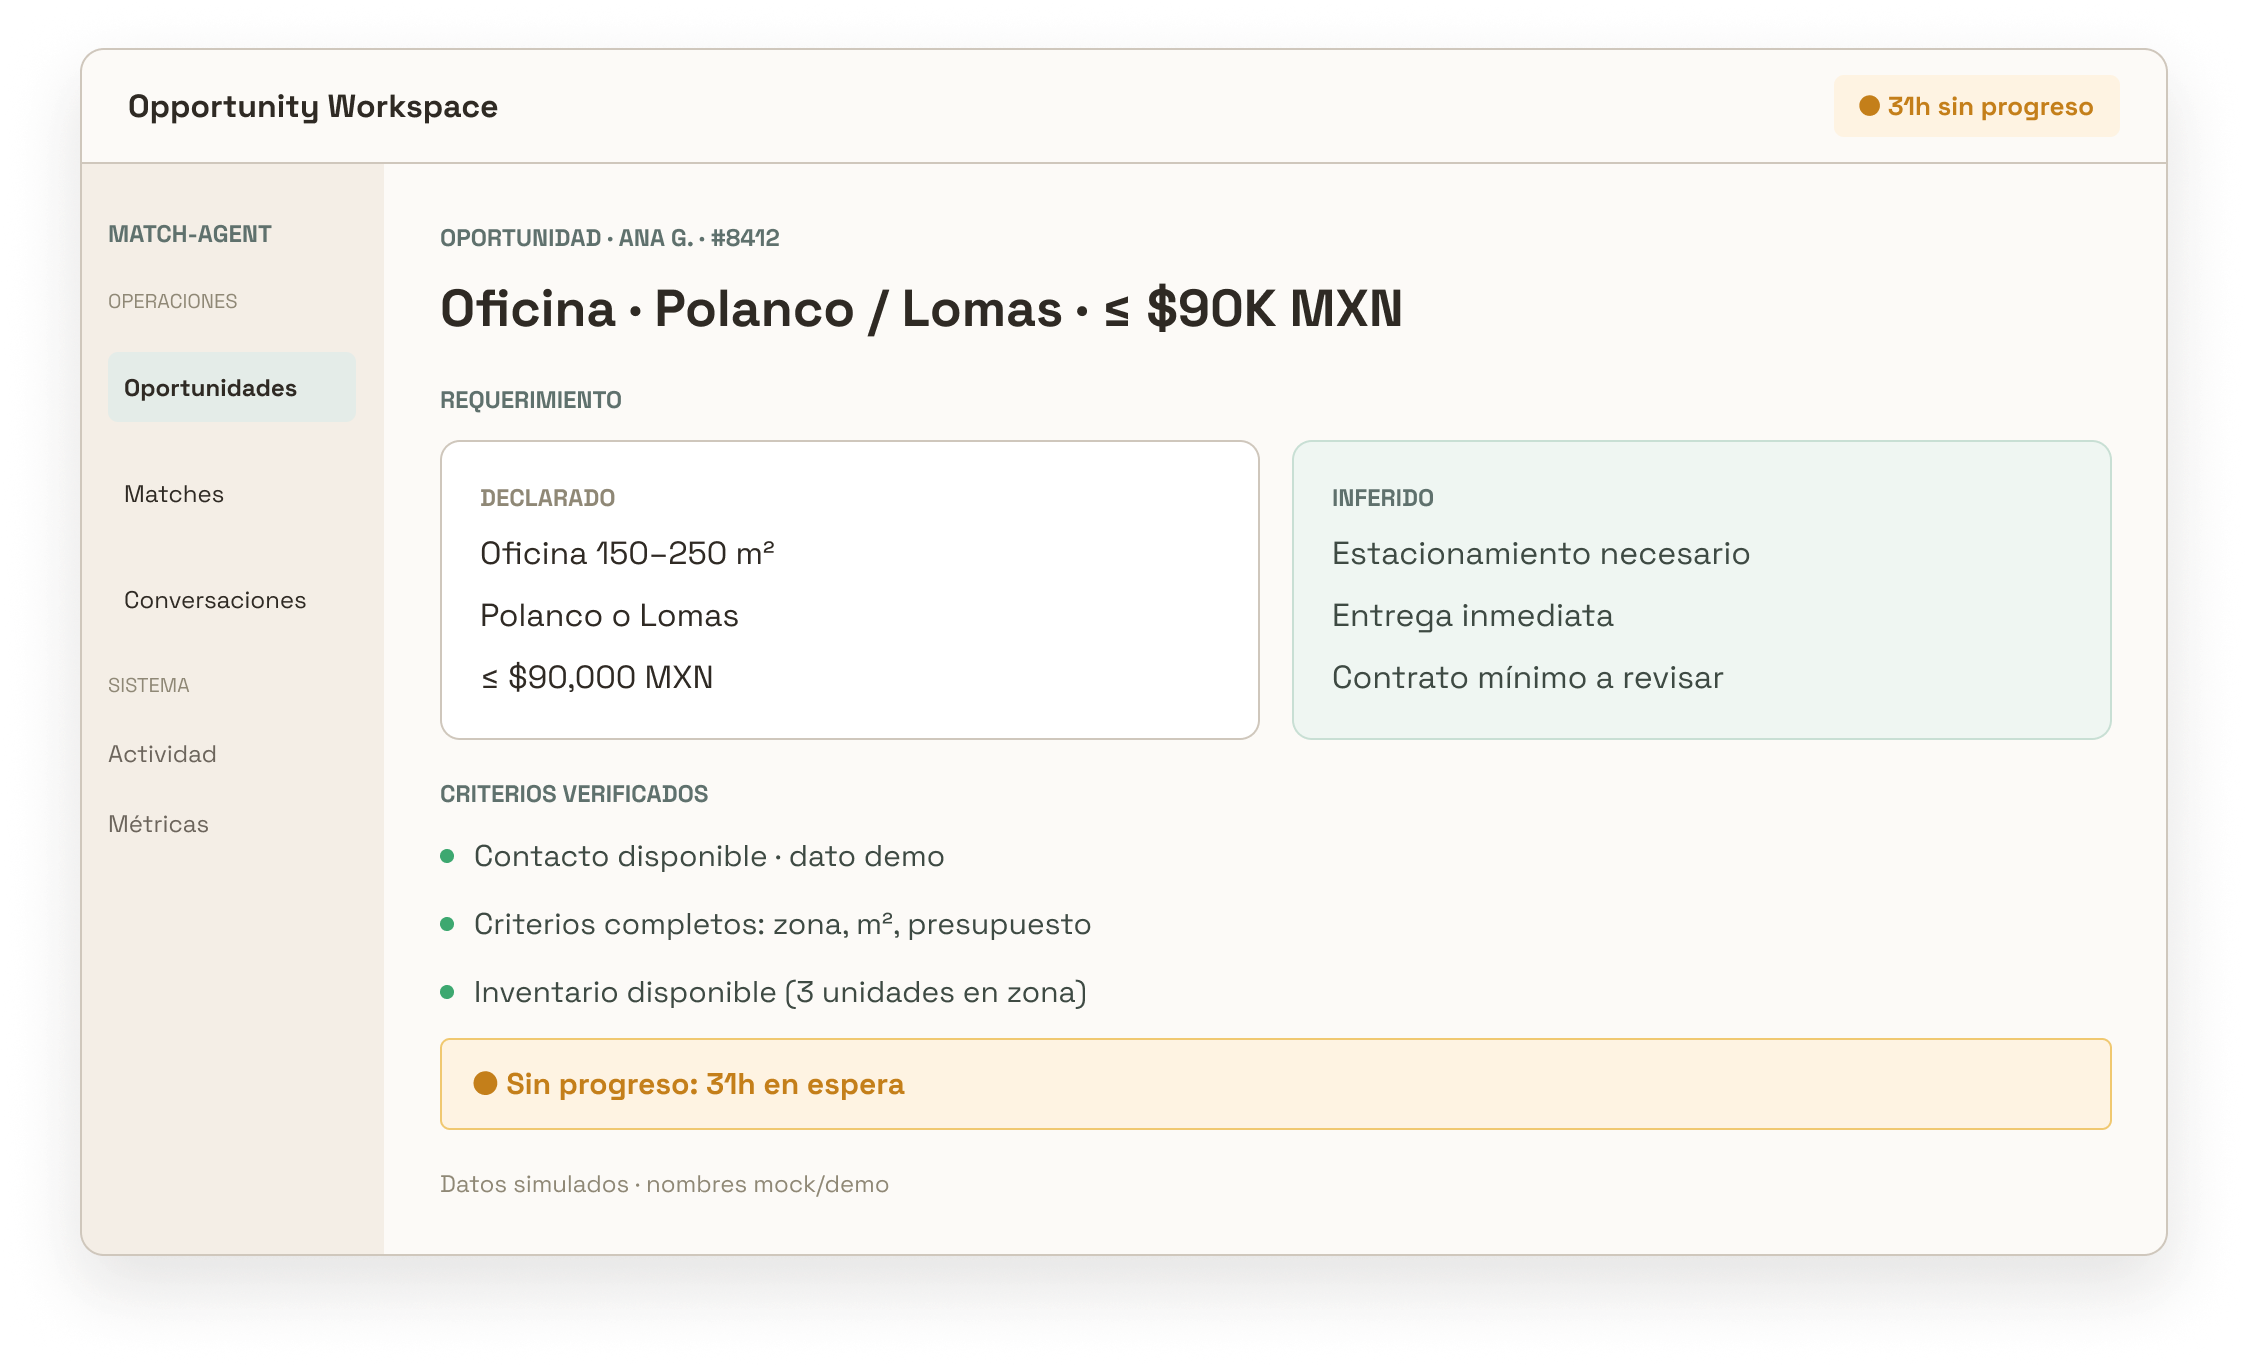
Moment 01 of 04: Interpret
07 / AI JUDGMENT
Not everything is automated. The system knows when to stop.
Each situation has a clear rule: continue, ask for review, or stop.
08 / MEASUREMENT
The next step wasn't scaling. It was validating whether the intervention moved the system.
We designed a conceptual pilot to test whether MatchAgent turns more opportunities into visits before scaling it. It's a proposal: it hasn't run yet.
PRIMARY METRIC
Baseline2.13%
of opportunities reached a scheduled visit. It's the starting point the pilot has to beat.
RESPONSE TIME
HypothesisMinutes
Hypothesis: respond in minutes, versus more than a day today.
GUARDRAILS
Safety limits4
Conditions that stop the pilot: wrong match, outdated inventory, user opt-out, and forced human intervention.
THE PILOT
What we test and what we measure
- 1
The pilot
50 eligible opportunities over 30 days, against a control group on the traditional workflow.
- 2
The journey
Each opportunity is tracked through 5 states: Eligible → Contacted → Replied → Viewed shortlist → Visit scheduled.
- 3
Secondary metrics
First-response rate and time, match acceptance, and shortlist engagement.
OBSERVED VS. HYPOTHESIS
What we expect to see
Response
More than a day → Minutes
Visit scheduled
2.13% → To be measured in the pilot
Coverage
Limited → All eligible demand
DECISION RULE
If the primary metric improves and the guardrails stay in range, scale. If a guardrail breaks, pause and iterate.
09 / LEARNINGS
Final reflection
MY ROLE
This project started with an open brief and no defined solution. My contribution was turning that starting point into a direction: I researched the marketplace's data and workflows, found where value was being lost, framed the insight, and turned it into a product proposal, with a prototype and a plan to validate it.
The proposal was selected among the winners of the hackathon's Mexico round.
WHAT I TAKE AWAY
- RESEARCH
- Starting with the data kept me from designing AI out of inertia. The opportunity wasn't where people talked most, but where the system lost continuity.
- DECIDE
- The most valuable work wasn't a screen. It was choosing what deserved to be built, and reusing what already existed instead of rebuilding it.
- EXPLAIN
- A recommendation without a reason doesn't get adopted. That's why every match shows its why, and the system knows when to bring in a person.
- VALIDATE
- A case doesn't end with a prototype. It ends when there's a clear way to know whether it worked, and to decide whether to scale or stop.
“Before deciding how to design, you have to decide what deserves to be designed.”
NEXT CONVERSATION
What's holding back your product's growth?
If you're dealing with conversion, activation, or experience friction, we can start by understanding what's happening and what's worth improving.
Tell me about your problem