SIAC
Redesign of a real-time monitoring platform for 20,347 critical assets.
An operations dashboard that brings IoT devices, alarms, asset tracking, and user management together in a dark, technical, high-density interface.
Interface shown in Spanish.
Context
SIAC is a real-time monitoring platform built for large-scale industrial operations. It brings the status of more than 20,000 critical assets (cameras, sensors, gateways, machinery, and staff) into a single operations dashboard.
The problem
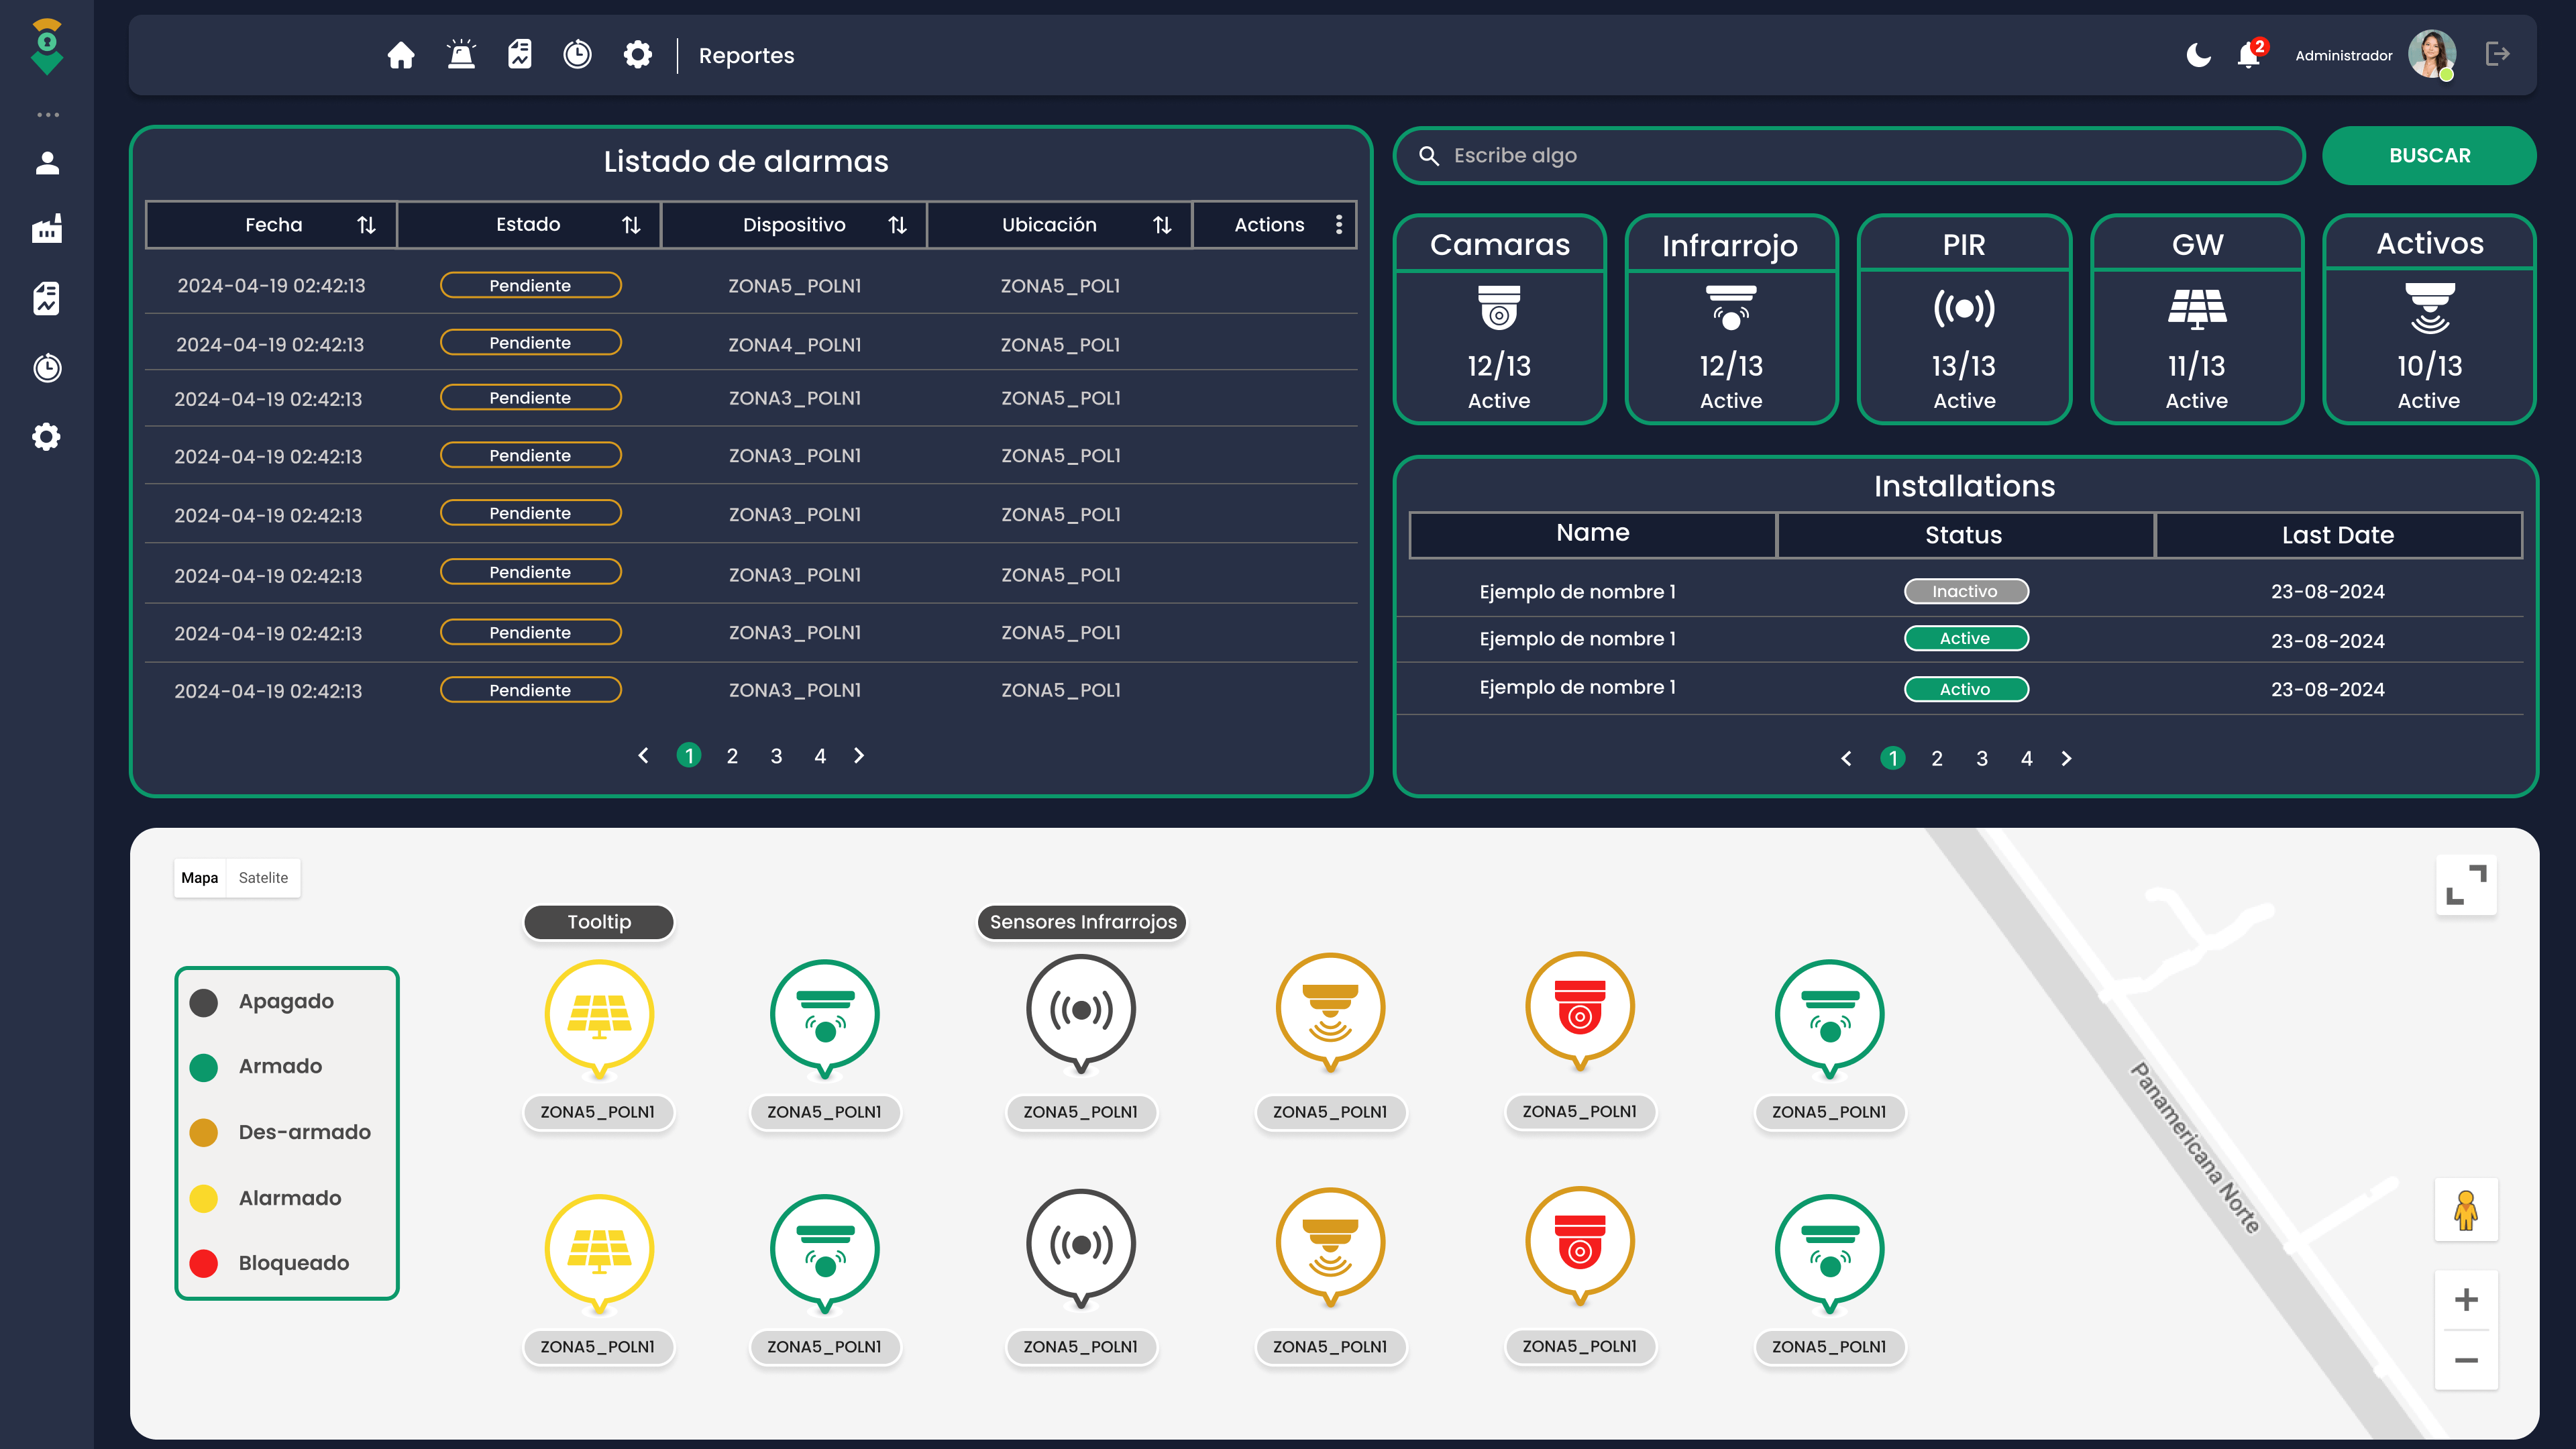
The previous system did its technical job, but it couldn't keep up with the speed the operation demanded. Barely distinguishable states, inconsistent visual tokens, and a confusing hierarchy meant operators took longer than necessary to read a critical alert.
Friction points
- Device states with similar colors and low contrast.
- No micro-feedback: actions with no immediate visual response.
- Dense information with no clear hierarchy.
- Clunky navigation between alarms, map, and assets.
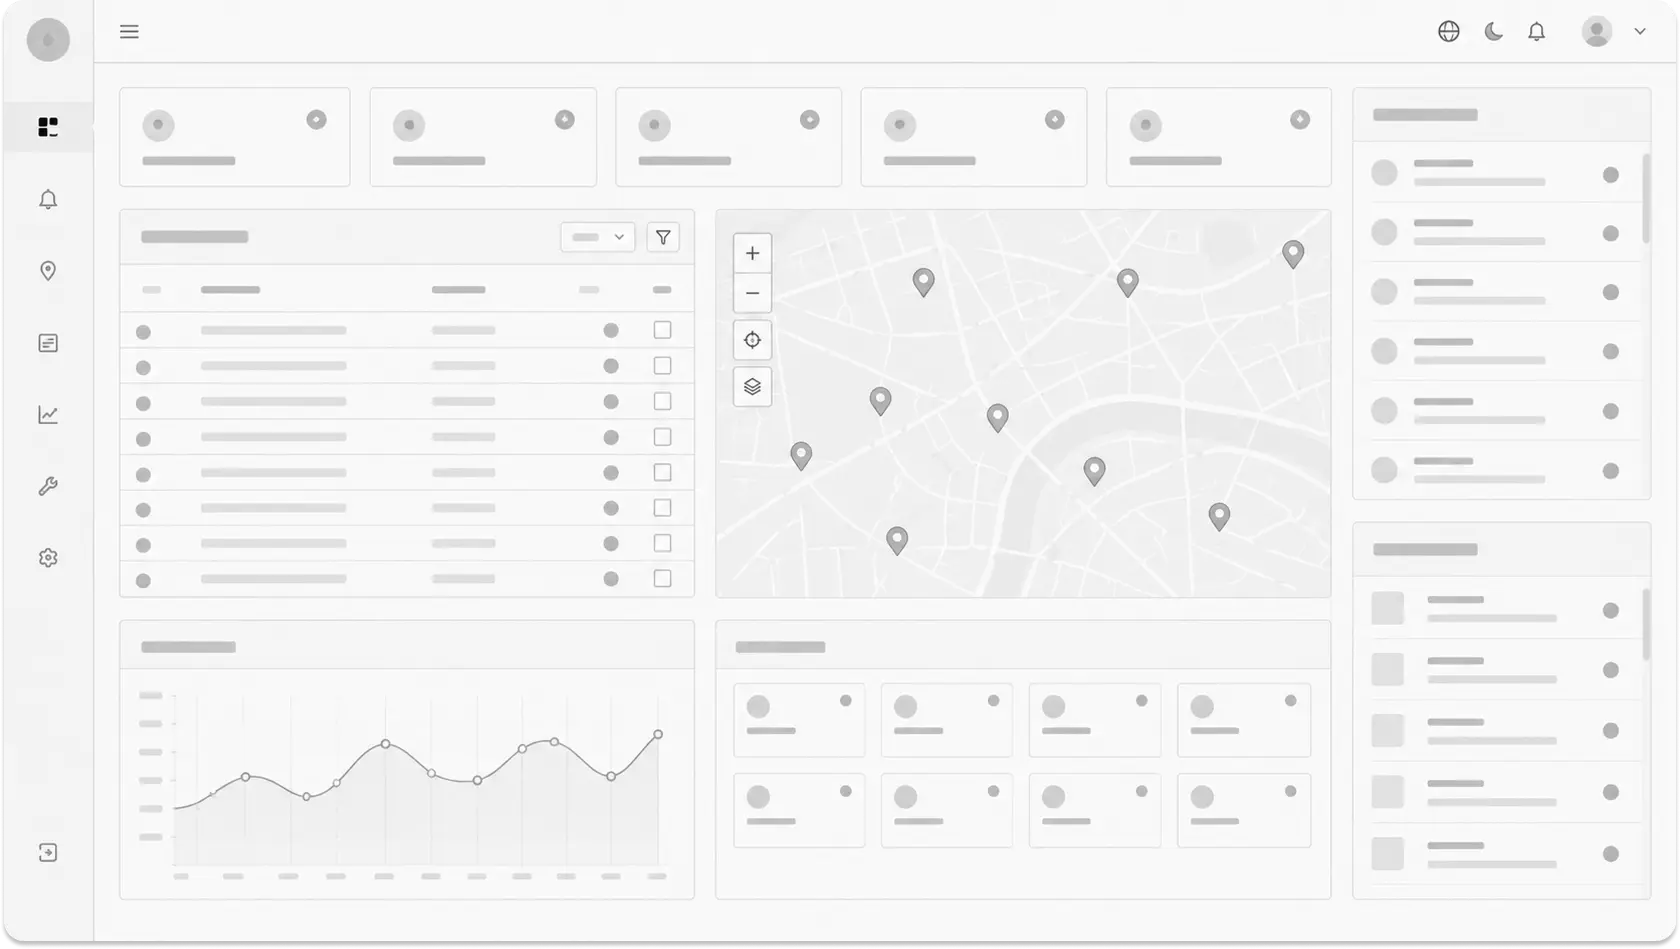
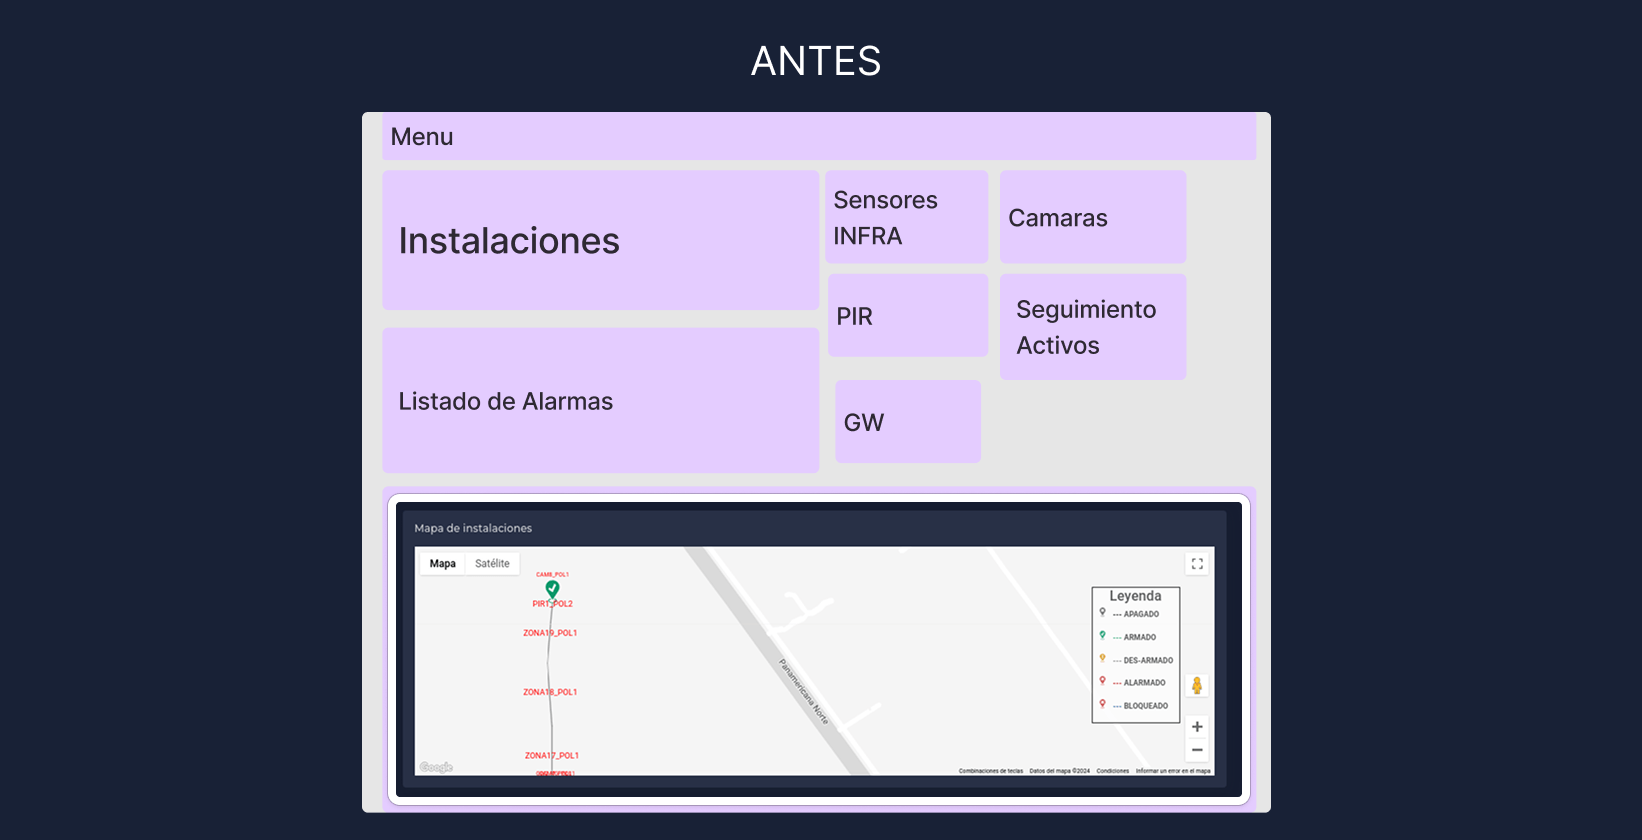
Low-fidelity wireframe: KPIs, alarms, map, and trends in a single view.
Research
I ran a UX audit of the live product. I reviewed operators' real workflows, the existing design tokens, and the points where critical decisions were made. The goal wasn't to replace everything but to remove what got in the operation's way.
Research activities
- Audited color tokens and operating states.
- Mapped alarm, tracking, and user-management flows.
- Reviewed UI density and type hierarchy.
- Identified points with no visual feedback.
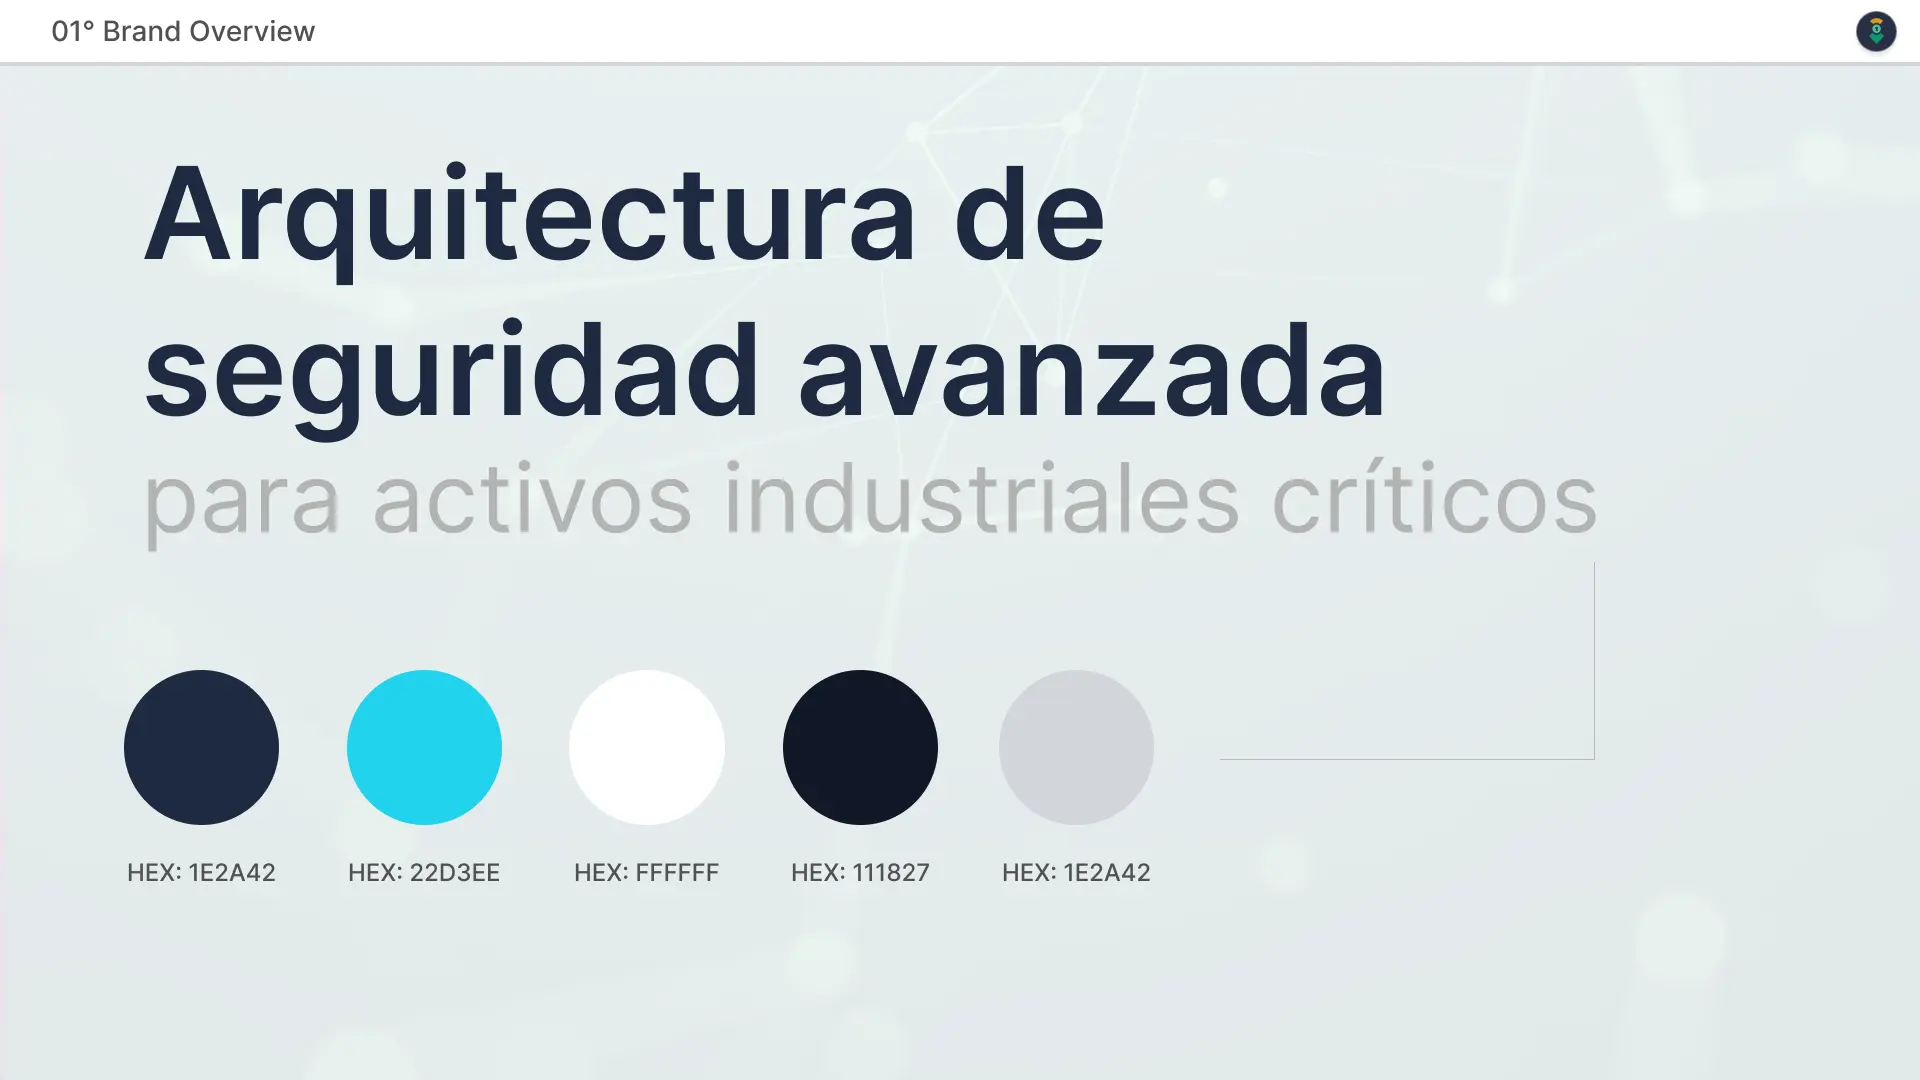
Brand sheet: SIAC's base palette.
Process
I designed a custom token system aligned with real operating states. I reorganized the interface so the most important information reads first, frequent actions are within reach, and every interaction gives immediate visual feedback.
Key decisions
- siac-* tokens for each operating state.
- Industrial dark theme with optimized contrast.
- Reusable components for KPIs, tables, maps, and alarms.
- Micro-animations with Framer Motion for feedback and perceived performance.
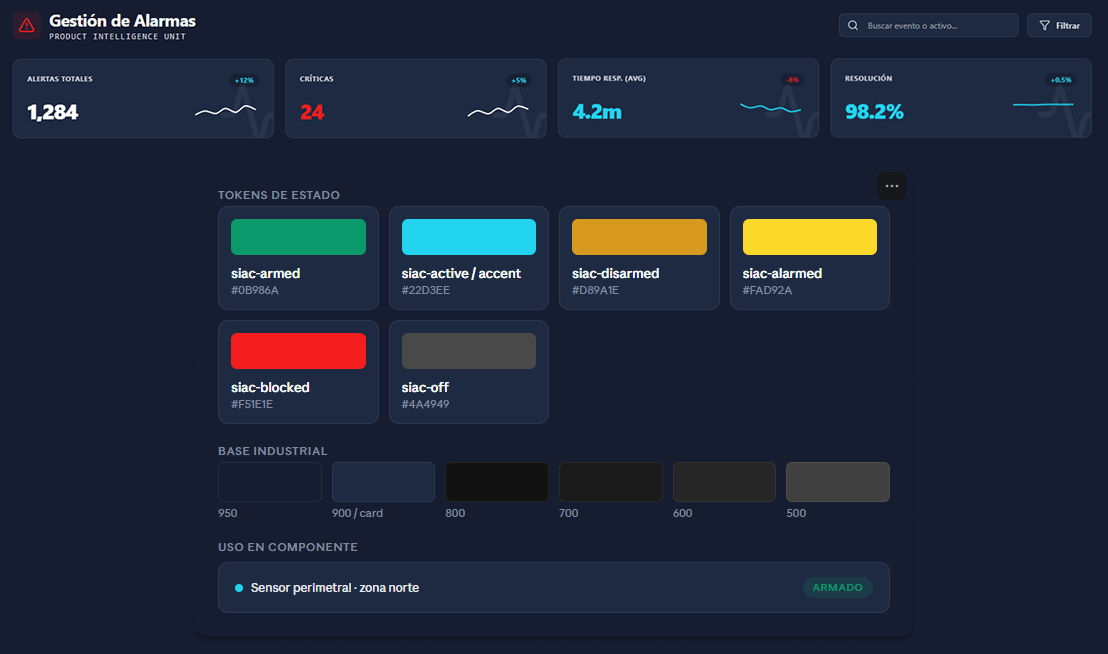
The solution
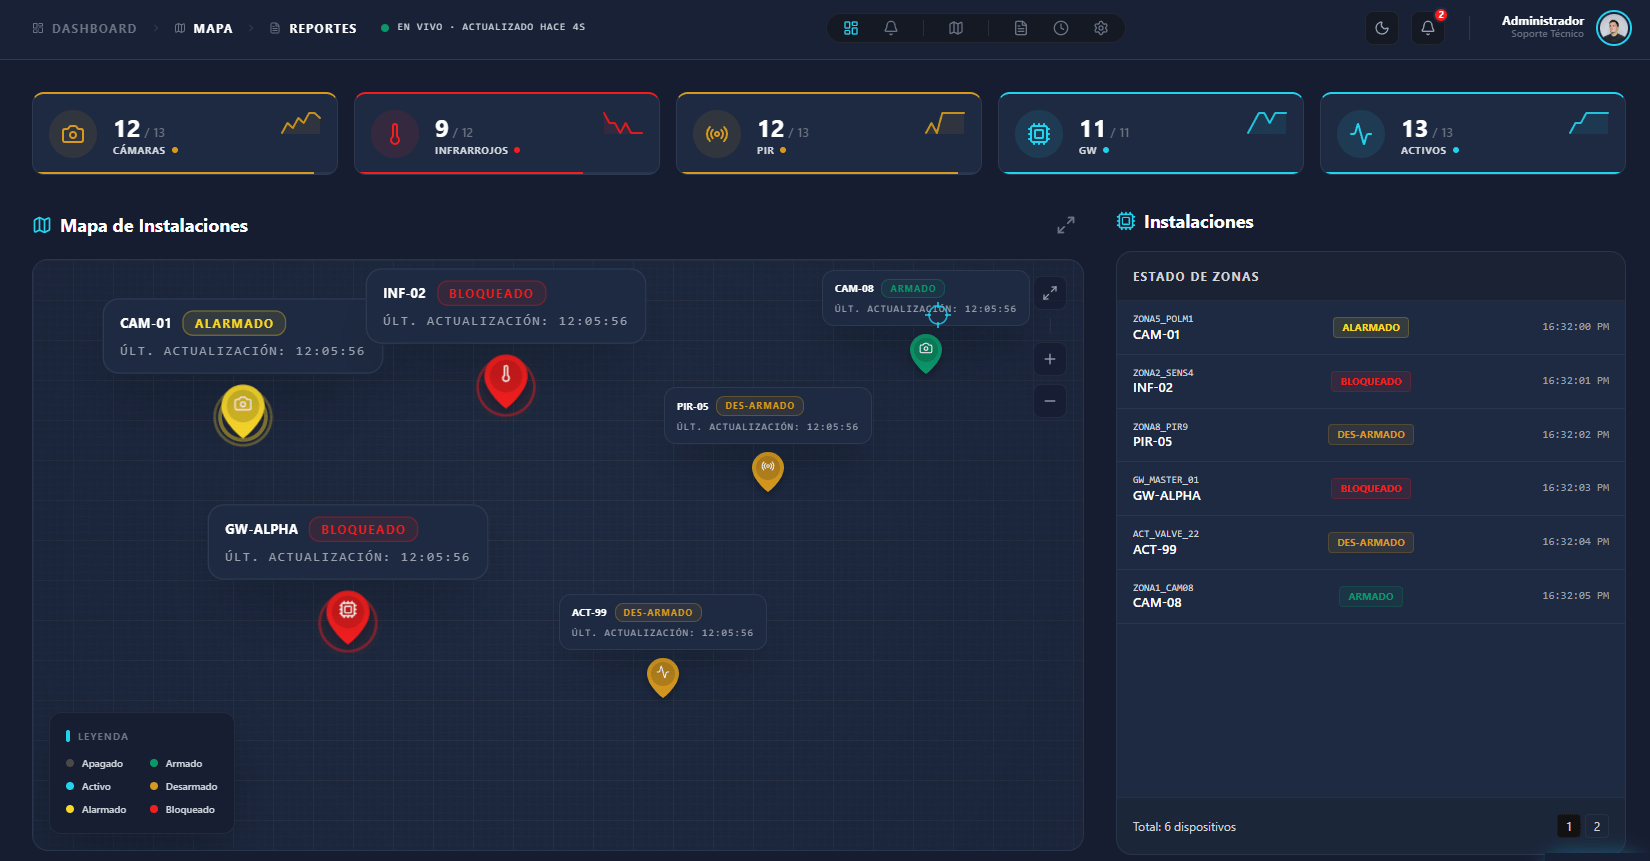
I redesigned 8 interconnected views that share one visual language. The dashboard gives an instant read of overall status, the map pinpoints any incident, alarms are handled in a few steps, and user management simplifies permission control.
Key features
- Real-time monitoring with automatic updates.
- Interactive map with status pins and simulated CCTV playback.
- Alarm management with resolution and report generation.
- Event timeline with technical metadata.
- IAM with roles, departments, and permissions by zone and camera.
Outcome
The new SIAC is designed so operators can read a critical alert at a glance and spend less time interpreting the interface and more time resolving incidents.
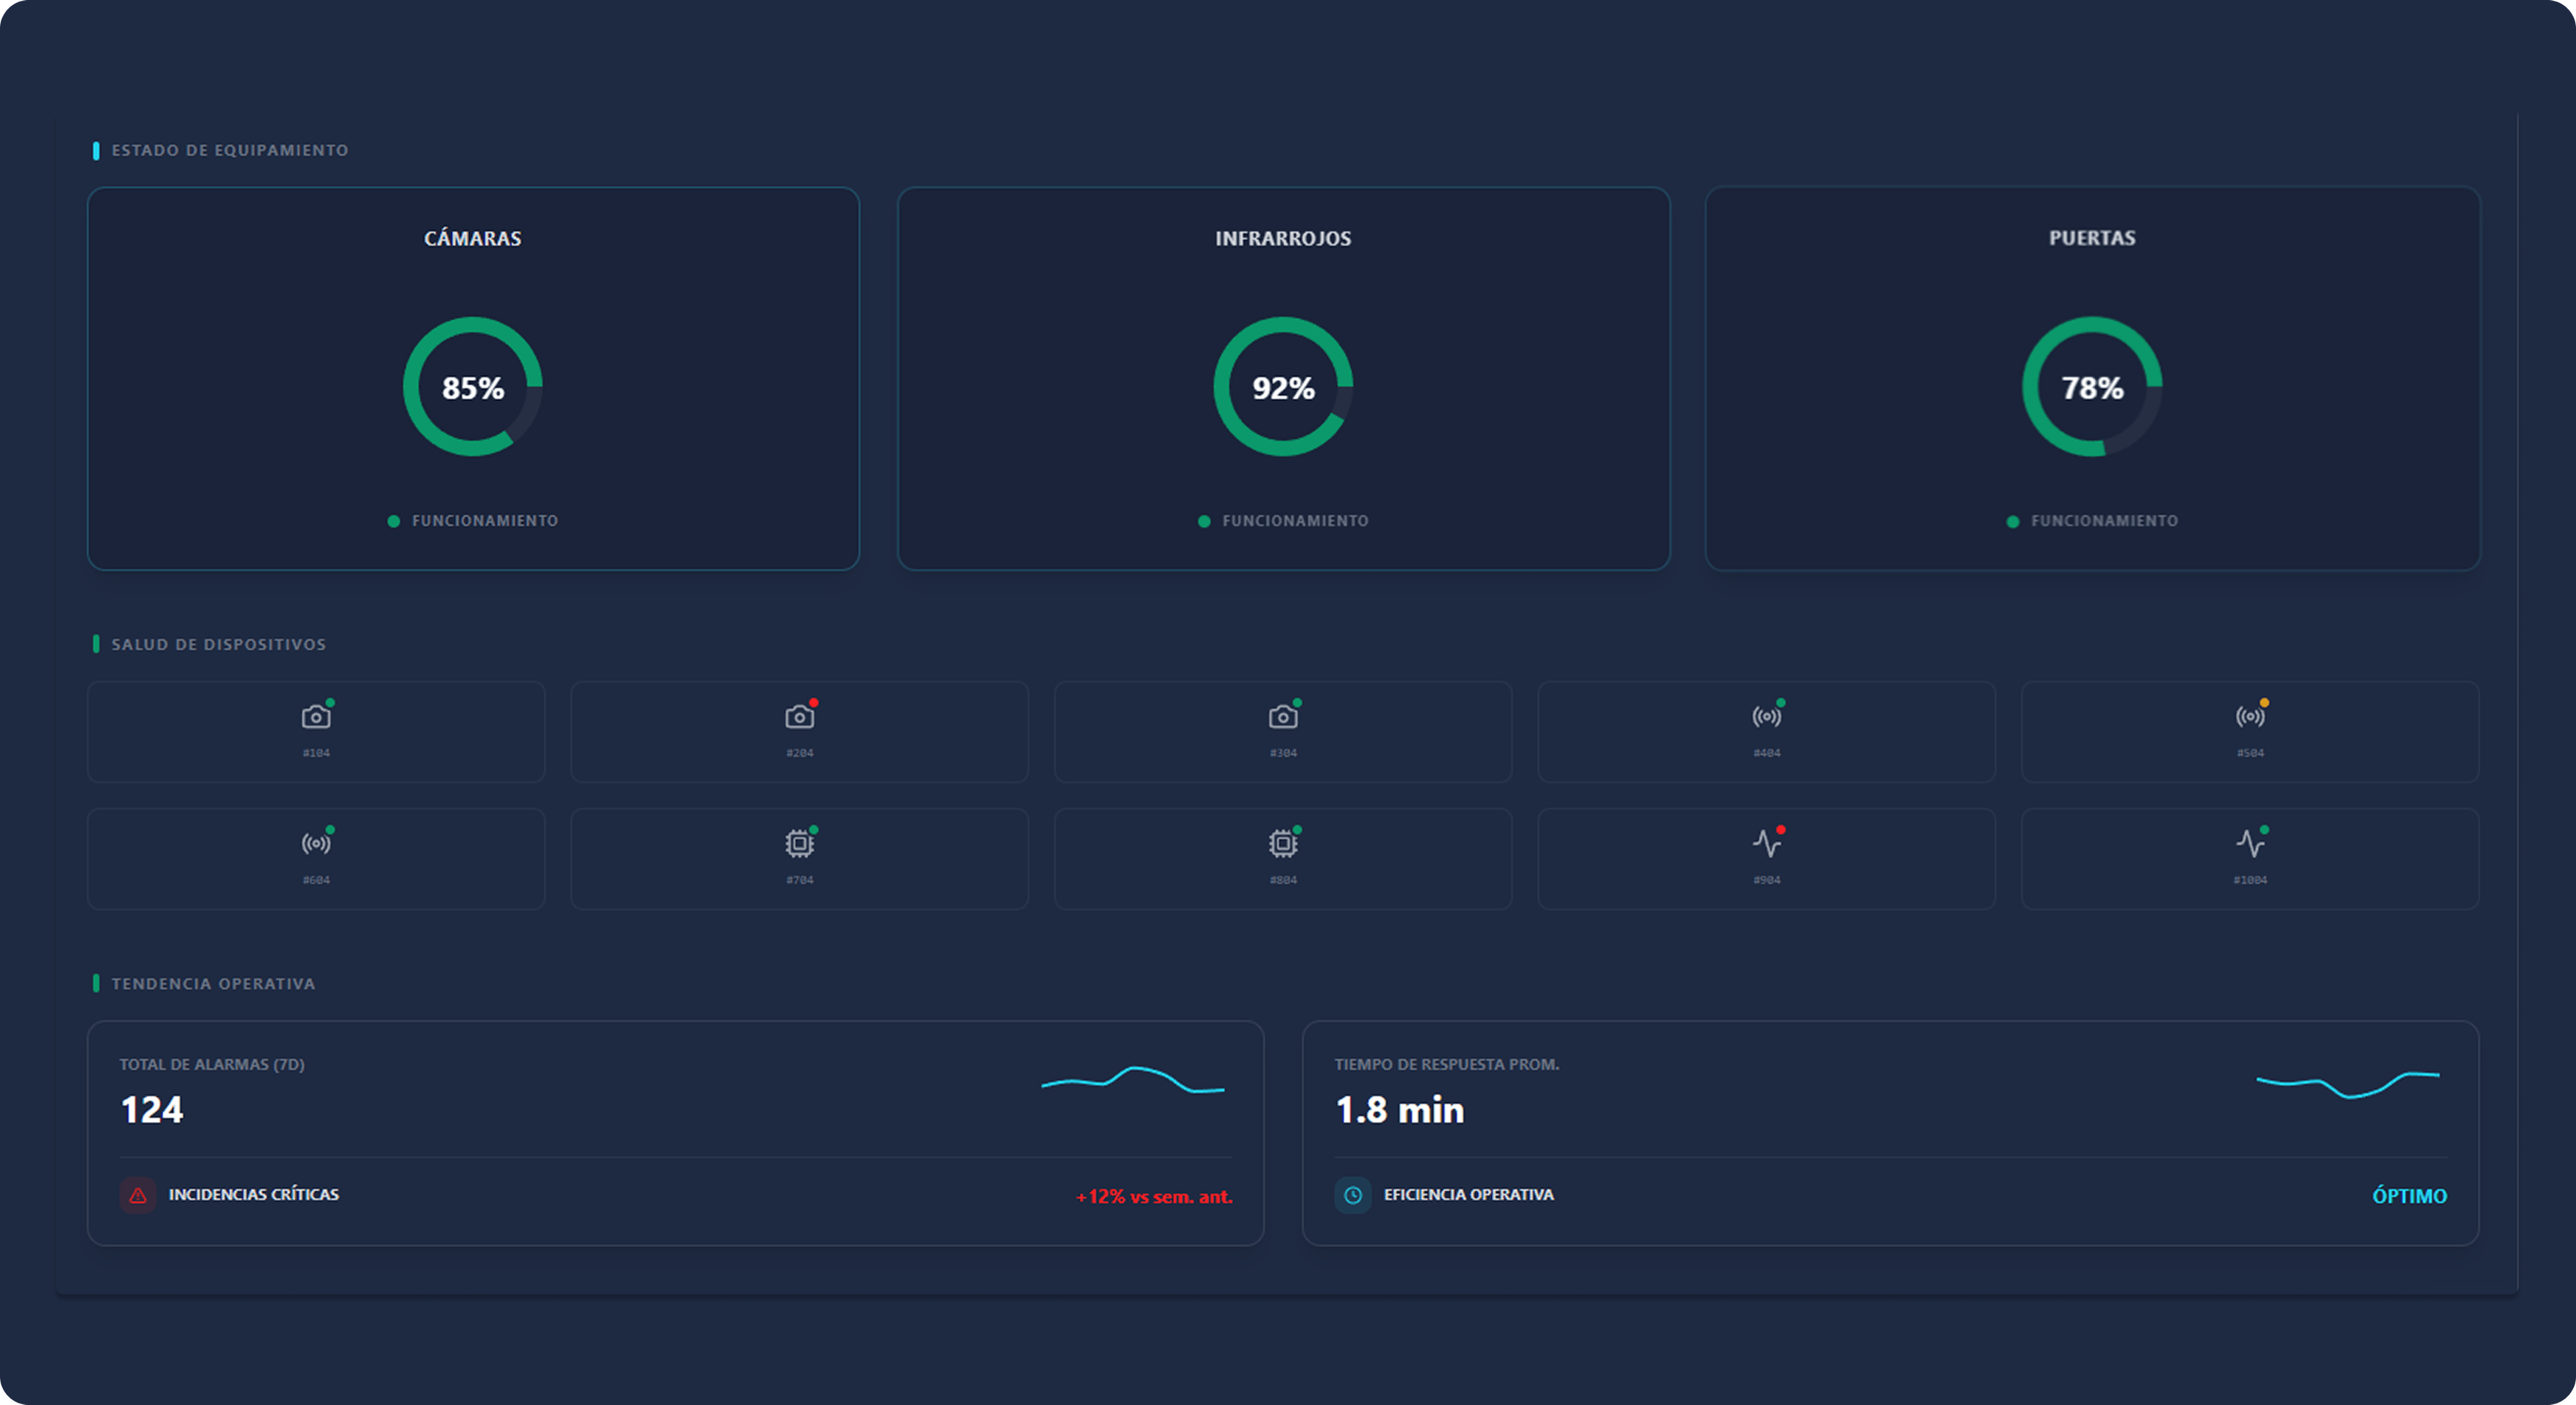
Equipment status panel: status by device type, per-device health, and operating trend.
Reflection
SIAC reminded me that in operational products, design is measured by what doesn't happen: misreadings, slow responses, missed alerts. A clear interface doesn't just look better: it makes the operation more reliable.
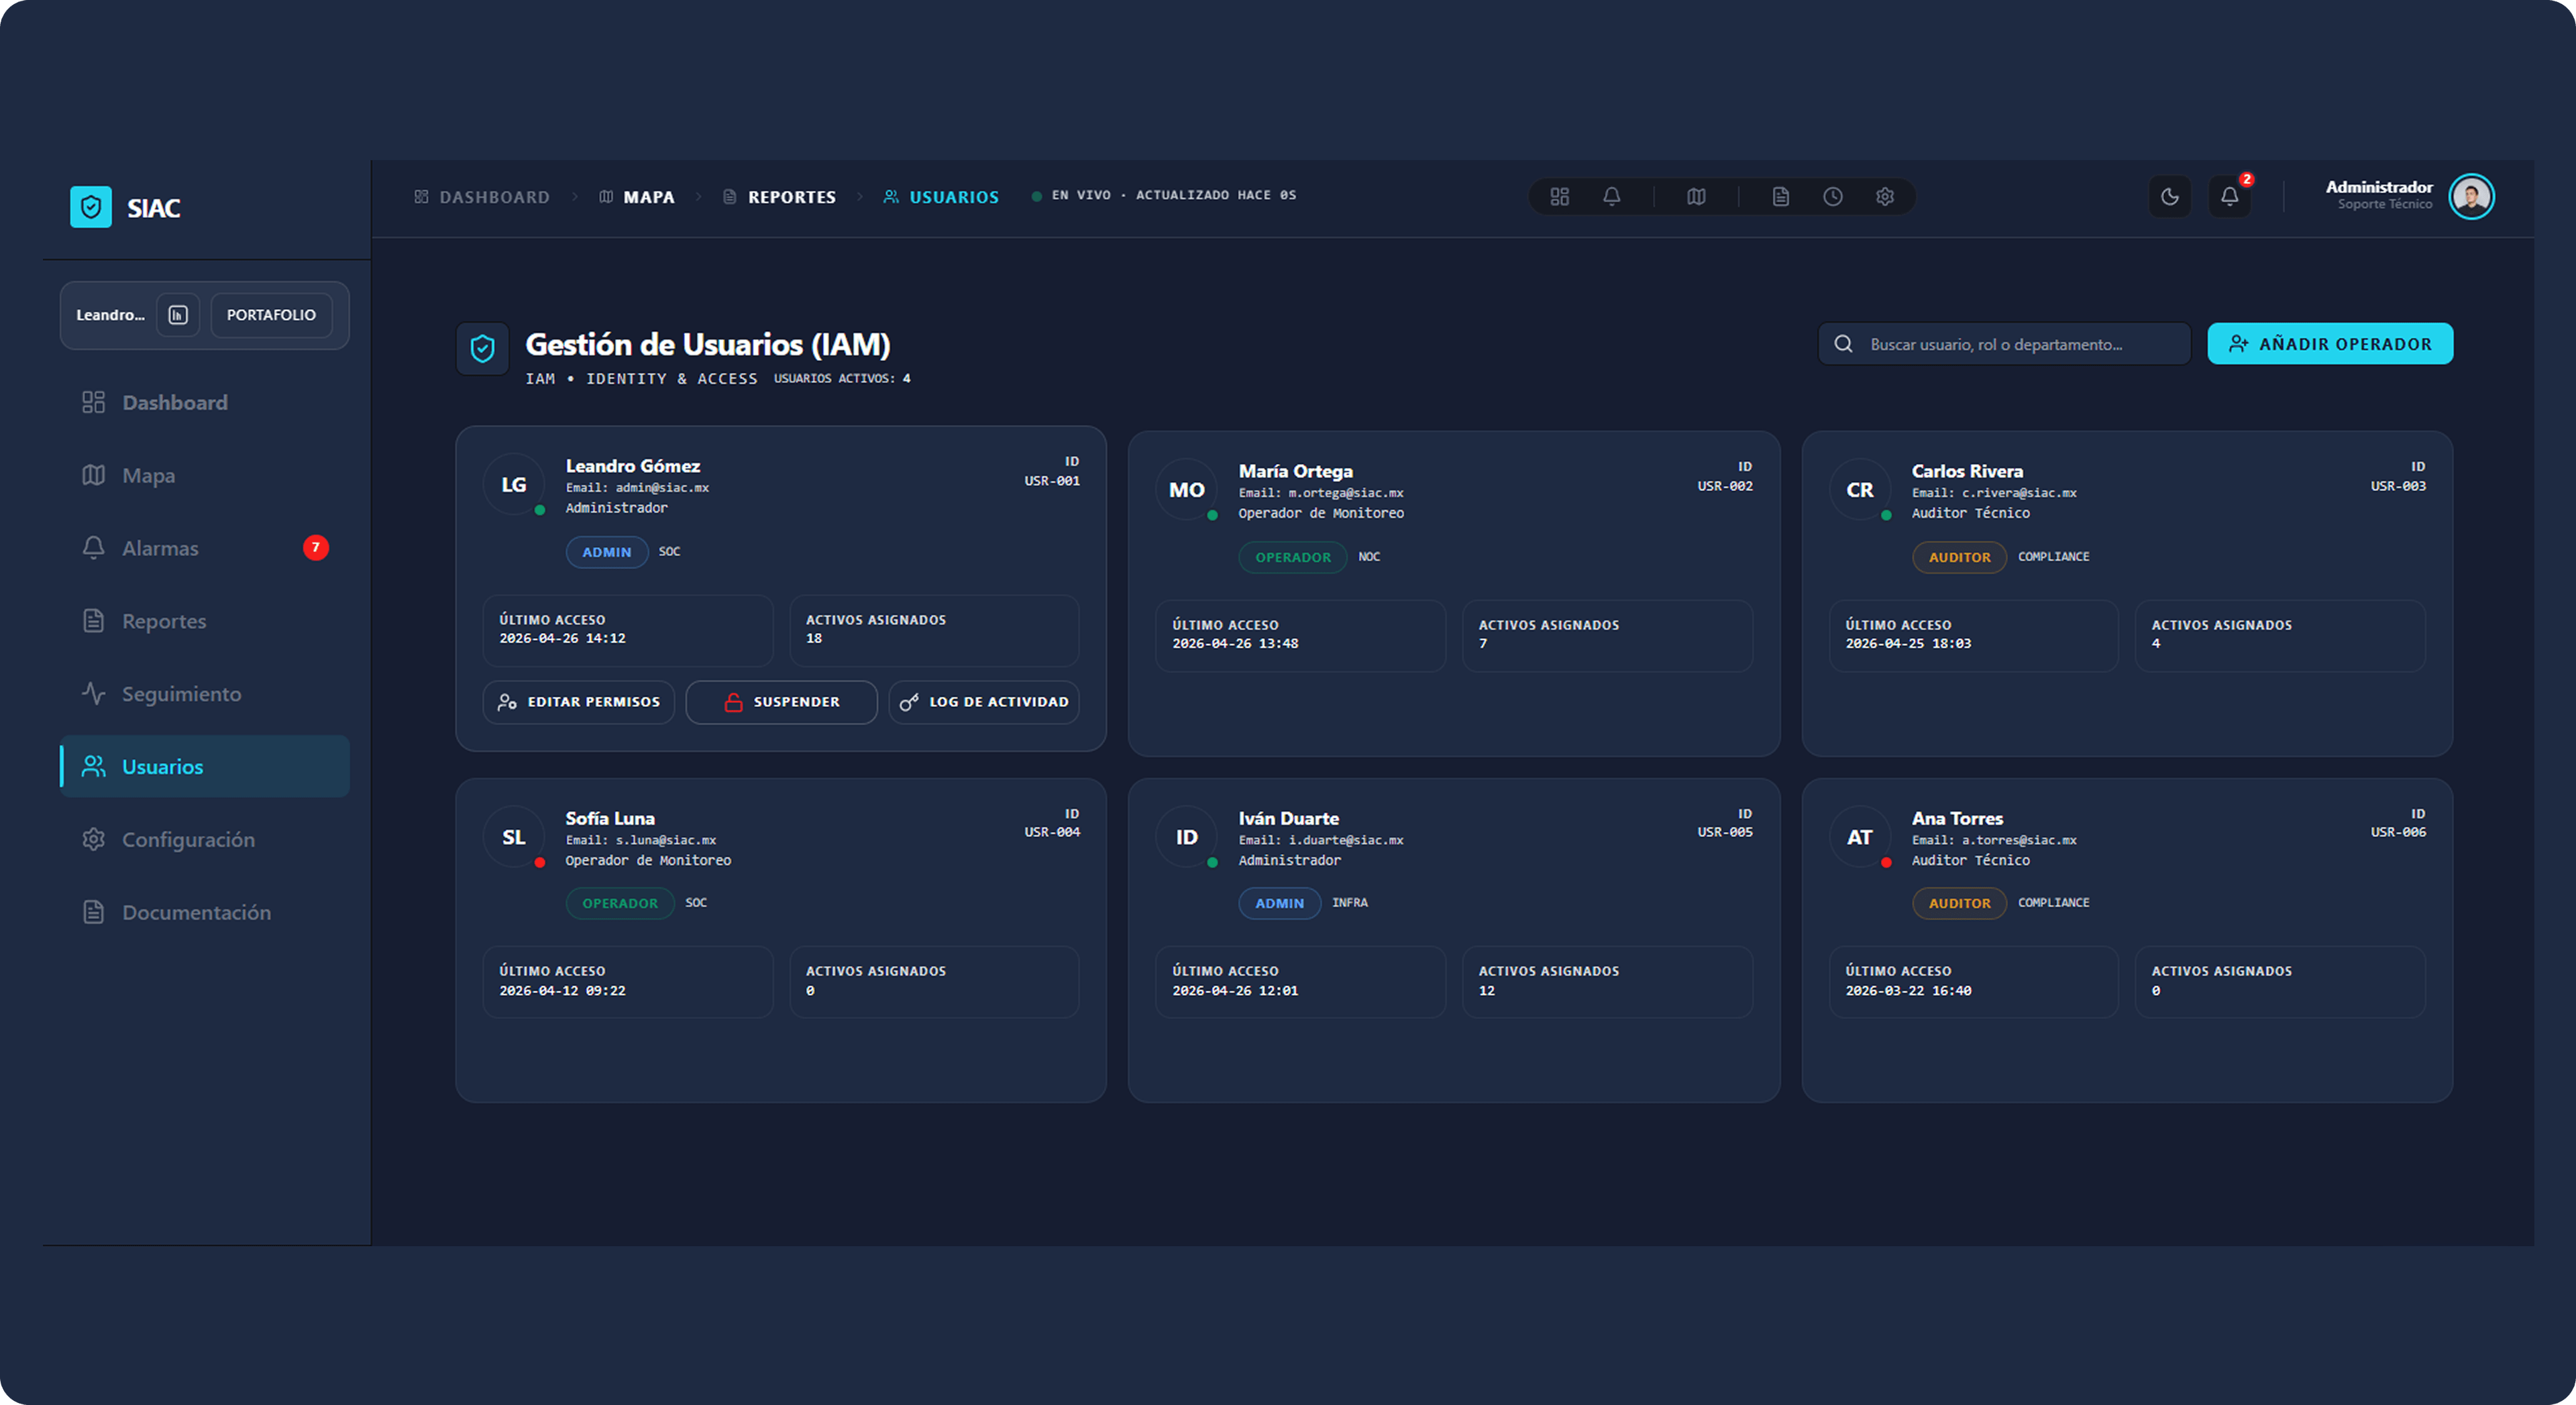
User management (IAM): roles, permissions, and assigned assets.